


Michael Fish wrote himself into UK folklore and became an overnight cultural icon all for the wrong reasons. In October 1987, Michael Fish stood in front of the BBC weather map and responded to a woman who had rung in worried about a hurricane, and viewers were not to worry, there wasn’t one coming. That night the worst storm since 1703 took down fifteen million trees. The Met Office’s failure was cadence. The models were respectable but the observations feeding them arrived too sparse and too slow to see a storm assembling over the Bay of Biscay. The fix, over the years that followed, involved better and faster moving data.
Marketing mix modelling is the ad industry’s Met Office, and most brands still run it in legacy ways. The discipline works. Sixty years of econometrics can decompose your sales into channel contributions, saturation curves and carryover effects, and the post-cookie signal collapse has driven a full MMM renaissance.
Meta open-sourced Robyn and Google gave us Meridian, two free, open-source tools for building these models, bringing down the entry price to build models. Google’s 2025 measurement report recorded a 212% rise in MMM adoption since 2023, eMarketer finds nearly half of US marketers planning fresh MMM investment this year, and a 2025 MediaPost survey found 74% of marketers reporting that privacy rules have created blind spots into their attribution, accepting that click-based alternatives just don’t work. Then the model reports in March on what happened last summer. A model that describes last year is an almanac.
The category advantage goes to the brand that turns it into fast-moving date for this week’s bids, and that conversion, from a dense rigorous model and document into a live optimiser, is the subject of this issue.
In a nutshell
Marketing mix modelling tends to come once a year as a report and at best one a quarter. An almanac that describes last year.
The category edge goes to whoever turns it into a live optimiser, refreshed weekly and wired into this week’s bids.
An MMM Optimiser comes across two builds. Build one puts the sales MMM on a fast clock. Build two models brand equity into the same bid using the brand’s own survey data.
The two effectively compound paying for tomorrow’s prospects as well as today’s lifts the organic base, and the loop keeps running.
For agencies it sells as an always-on optimizer on recurring margin-rich fees and agentic automation lets one senior head run both together.
Build one: the sales MMM on a fast clock
Start with what you already have, which is three years of sales, spend and channel performance, plus the category data (e.g competitor spend, pricing, seasonality and distribution). A Bayesian model refreshes weekly rather than annually, and validation of the model comes from geo holdouts and incrementality lift tests. Meridian accepts experiment results as assumptions which means the almanac and validation experimentation finally correct each other.
The model output translated into auction optimisers without a human in the loop for each decision. Channel elasticities become budget reallocation rules, saturation curves become spend caps that trigger before reaching diminishing returns, and the model’s read on true channel contribution inform bidding optimisations.
D2C brands Gousto and HelloFresh have talked publicly about rebuilding MMM in-house on exactly this logic. The model stops being a report and becomes a signal that powers bidding tactics.
Your competitor’s machine chases the platform’s number and default bidding levers. Yours chases a number the platform has no way to compute.
Build two: Fuse brand health metrics with channel performance
The second build essentially achieves brand equity at the speed of performance marketing. Binet and Field’s IPA work established that brand-building drives the base, the sales that arrive without a last click, and the base compounds while activation decays in weeks. The problem was that brand effects lived in a separate report, on a separate timescale, owned by a separate team, and no bidding system can act on a tracker deck.
Pricing brand equity into the bid
Resonance modelling closes that gap. It basically combines three years of channel spend data with brand survey insights - e.g awareness and perception - to show how different marketing activities truly influence audience response beyond just platform brand lift studies.
A brand can commission additional studies in its local markets and feed those in too, which gives all markets a weapon to optimise against, making it truly global. The model estimates two relationships. Firstly, which channels move which brand metrics, and secondly, how movements in those metrics convert into future base sales.
Think about what this does.
Inside a category where rivals run the default optimisation button, they bid on this week’s platform-measured conversions. Your are bidding on this week’s conversions plus a prediction of next year’s base, drawn from surveys of your actual consumers that no platform or competitor can see. What this means is figuring out the marginal cost per point of brand lift at cluster and channel level - which lets us model what it would take to close the gap in the category and building optimisation bidding strategies to get there.
The flywheel
The resonance layer directs money towards equity-building that a sales MMM alone would under-credit. Equity basically lifts the base of brand metrics, direct traffic, branded search, repeat purchase, and revenue. A rising base reduces dependence on paid harvesting tactics, which frees budget, which the model reallocates into whatever it has learned builds the base fastest, and self learning turn weekly optimisations into something incrementally better. Brands running the annual almanac experience this loop one to four times a year. On a weekly clock it turns roughly fifty times in the same period, and small compounding advantages taken fifty times a year are how category positions change hands.
The agency economics: selling an optimiser, not a one off build
Econometrics work is priced based on hours. Each new client meant new heads, each refresh meant a fee, and the P&L scaled at service margins. The two builds above break that relationship. The pipeline is a machine-learning product built once, refreshed by software, validated by incrementality experiments, monitored by a small central team.
An agency operating it for ten clients does not need ten times the analysts, and taking on the eleventh client adds a form of licence revenue with a marginal cost near zero. So revenue grows, headcount stays flat and contribution margin is boosted instead of eroding at service levels.
Agentic automation is what drops the marginal cost toward zero.
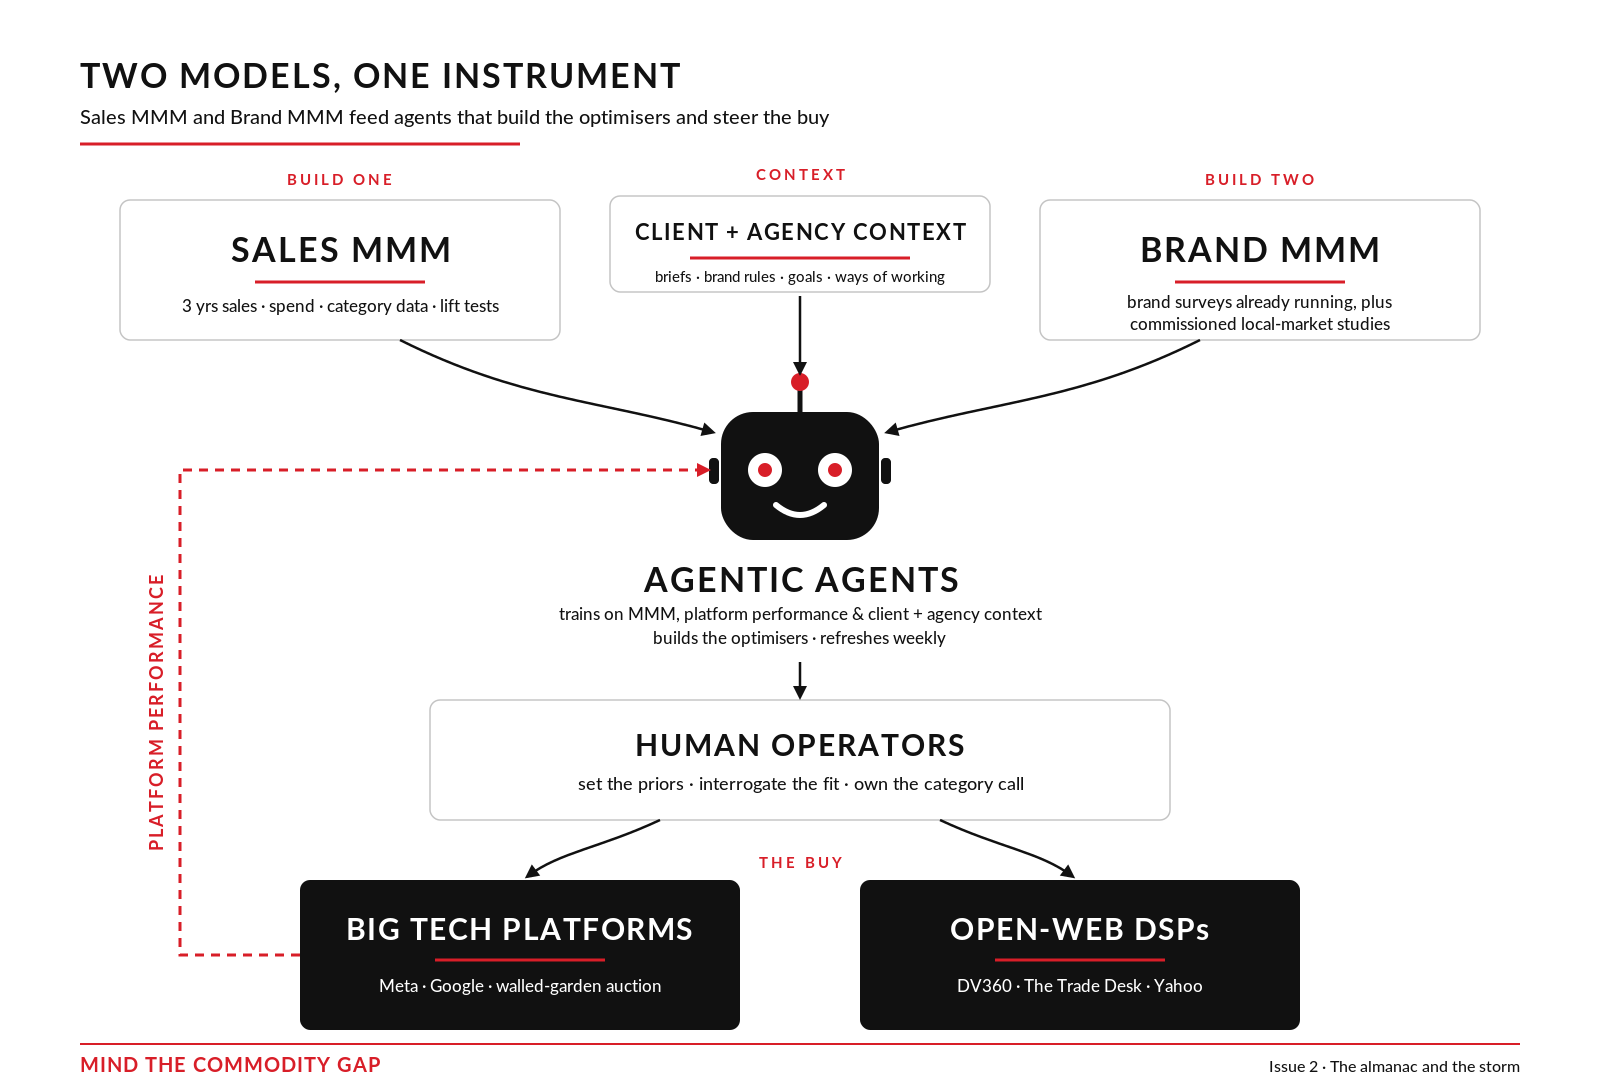
An MMM sales optimiser needs econometricians and data analysts to clean the panel, define assumptions, fit the Bayesian model, then manually code the elasticities into bidding rules.
Agents can cover it.
They ingest the sales and spend data, retrain the MMM on each weekly refreshes, and build the optimisation models that convert channel elasticities and saturation curves into bidding rules. The econometrician goes from constructing the model to interrogating it, setting the assumptions and catching the agent where things dont look right.
That changes the client conversation.
The agency starts selling an always-on optimiser, powered by the client’s own brand surveys, which makes the relationship harder to unwind. Switching agencies now means switching off the machine that steers business decisioning in real time. One honest caveat though. Weekly MMM is hard to wholly maintain through automation - e.g data pipelines break, Bayesian models need assumptions chosen by someone who knows the category, and a model refreshed can be wrong, which is why the incrementality lift-test validation in build one is so important.
The Met Office evolved with more observations and faster modelling into action and British weather forecasting is among the very best in the world. The tools exist for weather and for media. The brands still running annual MMM have chosen the legacy model, and somewhere in their category, low pressure is forming.
An MMM sales optimiser needs econometricians and data analysts to clean the panel, define assumptions, fit the Bayesian model, then manually code the elasticities into bidding rules.
Agents can cover it.
They ingest the sales and spend data, retrain the MMM on each weekly refreshes, and build the optimisation models that convert channel elasticities and saturation curves into bidding rules. The econometrician goes from constructing the model to interrogating it, setting the assumptions and catching the agent where things dont look right.
That changes the client conversation.
The agency starts selling an always-on optimiser, powered by the client’s own brand surveys, which makes the relationship harder to unwind. Switching agencies now means switching off the machine that steers business decisioning in real time. One honest caveat though. Weekly MMM is hard to wholly maintain through automation - e.g data pipelines break, Bayesian models need assumptions chosen by someone who knows the category, and a model refreshed can be wrong, which is why the incrementality lift-test validation in build one is so important.
The Met Office evolved with more observations and faster modelling into action and British weather forecasting is among the very best in the world. The tools exist for weather and for media. The brands still running annual MMM have chosen the legacy model, and somewhere in their category, low pressure is forming.
This is Erfan Djazmi, sharing notes on the commodity gap in marketing, from someone who spent five years at IPG decommoditising agency and client investment.